 Applied to: SQL Server (2005-2022) , Azure SQL Database, Azure Synapse, Azure Fabric.
A common cause of slow SQL Server performance is a heavy database application workload, and the nature of the queries themselves. Thus, to analyze the cause of a system bottleneck, it is important to examine the database application workload and identify the SQL queries causing the most stress on system resources.
You can use SQL Profiler to capture activities performed on a SQL Server instance such capture is called a Profiler Trace. You can use a Profiler trace to capture events generated by various subsystems within SQL Server. You can run traces from the graphical front end or through direct calls to the procedures. The most efficient way to define a trace is through the system procedures, but a good place to start learning about traces is through the GUI.
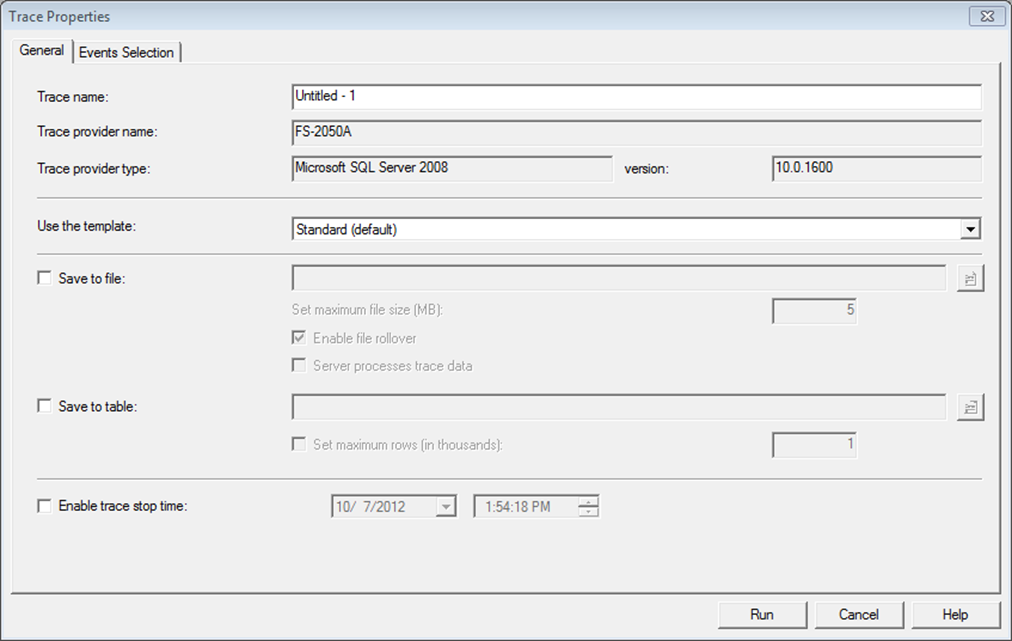
You can supply a trace name to help categorize your traces later when you have lots of them. Different trace templates are available that quickly help you set up new traces for different purposes.
The Events selection tab provide more detailed definition to your trace. An event represents various activities performed in SQL Server. These are categorized for easy clarification into event classes, cursor events, lock events, stored procedure events, and T-Sql events are a few common event classes. For performance analysis, you are mainly interested in the events that help you judge levels of resource stress for various activities performed on SQL Server.
Data Columns: Events are represented by different attributes called data columns. The data columns represent different attributes of an event, such as the class of the event, the SQL statement for the event, the resource cost of the event, and the source of the event.
Filters: In addition to defining events and data columns for a Profiler trace, you can also define various filter criteria. These helps keep the trace output small, which is usually a good idea.
Avoid capturing too many event and data column: While tracing SQL queries, you can decide which SQL activities should be captured by filtering events and data columns. Choosing extra events contributes to the bulk of tracing overhead. Minimizing the number of events to be captured events SQL Server from wasting the bandwidth of valuable resource generating all those events.
Run It Remotely: Profiler has a heavy user interface; therefore, it is better to run it on another machine. Profiler should not run through a terminal service session, because a major part of the tool still runs on the server.
Just Use it for Short-Term Analysis: Running SQL Profiler for long-term monitoring and analysis is not recommended due to high resource consumption.
Consider Performance Impact: Running SQL Profiler reduce the SQL Server performance, therefore you should use it for short-term analysis.
Avoid Online Data Column Sorting: During performance analysis, you usually sort a trace output on different data columns to identify queries with the largest corresponding figures. If you sort offline, you reduce the activities Profiler has to perform while interacting with SQL Server.
Limit Trace Output File: Besides pre-filtering events and data columns, other filtering criteria is limiting the trace output file size. Limiting size may cause you to miss interesting events if you are looking at overall system behavior.
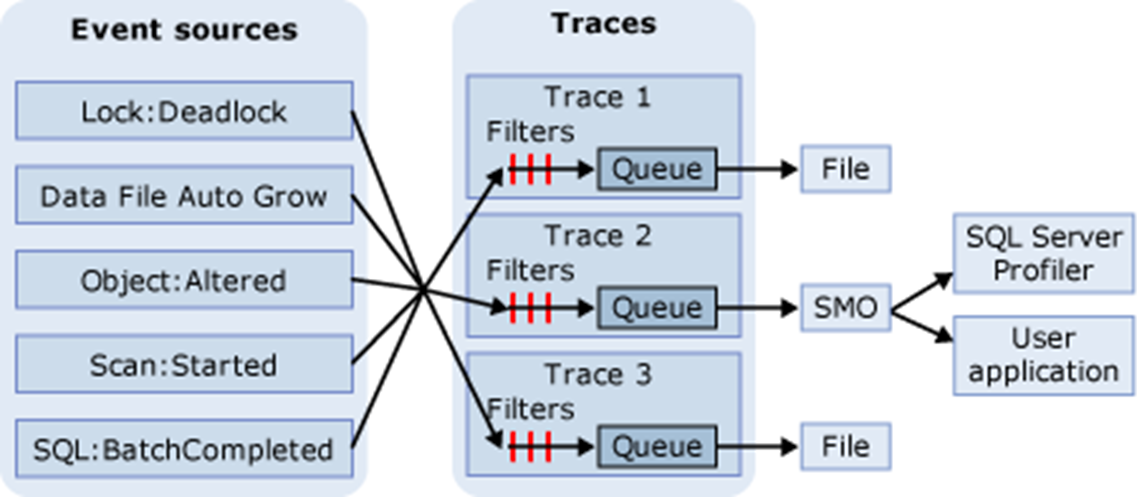
In SQL Trace, events are gathered if they are instances of event classes listed in the trace definition. These events can be filtered out of the trace or queued for their destination. The destination can be a file or SQL Server Management Objects (SMO), which can use the trace information in applications that manage SQL Server. The diagram shows how SQL Trace gathers events during a tracing.
SQL Trace Tool is built-in SQL Server Database Engine, also is very light-weight. You may set it up as automated for long-term tracing and analysis.
Setting up a trace allows you to collect a lot of data for later use, but the collection can be somewhat expensive, and you have to wait on the results. If you need to immediately capture performance metrics about your system, especially as they pertain to query performance, then the dynamic management view sys.dm_exec_query_stats is what you need. Since sys.dm_exec_query_stats is just a view, you can simply query against it and get information about the statistics of query plans on the server.
You will need to join it with other dynamic management functions such as sys.dm_exec_sql_test, which shows the query text associated with the plan, or sys.dm_exec_query_plan, which has the execution plan for the query.
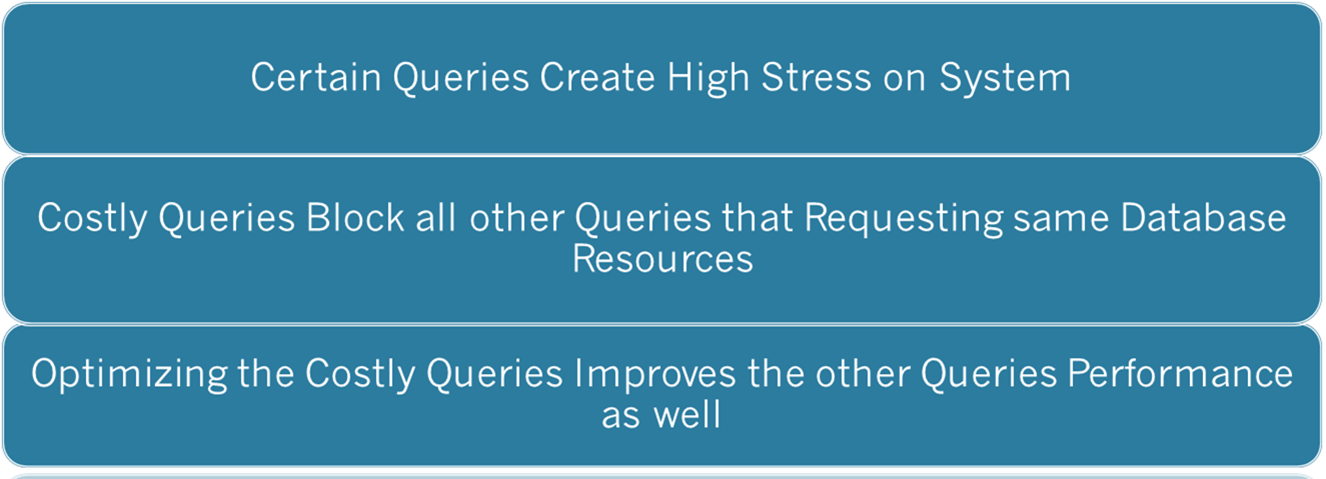
Now that you have seen what you need to consider when using the Profiler tool, lets look at what the data represents, the costly queries themselves. When the performance of SQL Server goes bad, two things are most likely happening:
First, certain queries create high stress on system resources, these queries affect the performance of the overall system, because the server becomes incapable of serving other SQL queries fast enough. Additionally, the costly queries block all other queries requesting the same database resource, further degrading the performance of those queries. Optimizing the costly queries improves not only their own performance but also the performance of other queries by reducing database blocking and pressure on Sql server resources.
The goal of SQL Server is to return result sets to the user in the shortest time. To do this, SQL Server has a built-in, cost-based optimizer called the query optimizer, which generates a cost-effective strategy called a query execution plan. The query optimizer weighs many factors, including the usage of CPU, memory and disk I/O required to execute a query, all derived from the statistics maintained by indexes or generated on the fly, and it then creates a cost-effective execution plan.
The queries that cause a large number of logical reads usually acquire locks on a corresponding large set of data. Even reading requires shared locks on all data. These queries block all other queries requesting this data for the purposes of modifying it, not for reading it. Since these queries are inherently costly and require a long time to execute, they block other queries for an extended period of time. The blocked queries then cause blocks on further queries, introducing a chain of blocking in the database.
The costly query can be categorized into the following two types:
You can identify the costly queries by analyzing a SQL Profiler trace output file or by querying sys.dm_exec_query_stats DMV. By using the following T-SQL statement, you can find the multiple executions costly queries.
SELECT COUNT(*) AS 'TOTAL EXECUTIONS',
SUM(DURATION) AS 'TOTAL DURATION',
SUM(CPU) AS 'TOTAL CPU',
SUM(READS) AS 'TOTAL READS',
SUM(WRITES) AS 'TOTAL WRITES'
FROM TRACE_TABLE
GROUPBY EVENTCLASS, CAST (TEXTDATA AS NVARCHAR(MAX))
ORDER BY 'TOTAL READS' DESC;
SELECT SS.SUM_EXECUTION_COUNT , T.TEXT,
SS.SUM_TOTAL_ELAPSED_TIME , SS.SUM_TOTAL_WORKER_TIME,
SS.SUM_TOTAL_LOGICAL_READS , SS.SUM_TOTAL_LOGICAL_WRITES
FROM ( SELECT S.PLAN_HANDLE , SUM(S.EXECUTION_COUNT) AS 'SUM_EXECUTION_COUNT',
SUM(S.TOTAL_ELAPSED_TIME) AS 'SUM_TOTAL_ELAPSED_TIME',
SUM(S.TOTAL_WORKER_TIME) AS 'SUM_TOTAL_WORKER_TIME',
SUM(S.TOTAL_LOGICAL_READS) AS 'SUM_TOTAL_LOGICAL_READS',
SUM(S.TOTAL_LOGICAL_WRITES) AS 'SUM_TOTAL_LOGICAL_WRITES'
FROM SYS.DM_EXEC_QUERY_STATS AS S
GROUP BY S.PLAN_HANDLE ) AS SS
CROSS APPLY SYS.DM_EXEC_SQL_TEXT(SS.PLAN_HANDLE) T
ORDER BY SUM_TOTAL_LOGICAL_READS DESC
Identifying Slow-Running Queries
Because a user’s experience is highly influenced by the response time of their requests, you should regularly monitor the execution time of incoming SQL queries and find out the response time of slow-running queries. If the response time of slow-running queries becomes unacceptable, then you should analyze the cause of performance degradation. Not every slow-performing query is cause by resource issues, though. Other concerns such as blocking can also lead to slow query performance. For slow running system, you should note the duration of slow-running queries before and after the optimization process. After you apply optimization techniques, you should then work out the overall effect on the system. It is possible that your optimization steps may have adversely affected other queries, making them slower.

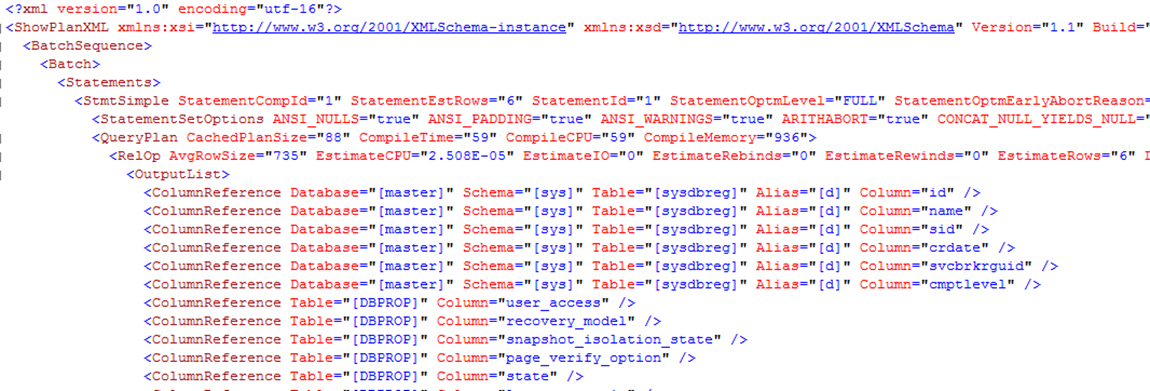
An execution plan shows the processing strategy used by the query optimizer to execute a query. To create an execution plan, the query optimizer evaluates various permutations of indexes and join strategies. Because of the possibility of a large number of potential plans, this optimization process may take a long time to generate the most cost-effective execution plan. SQL Server displays a query execution plan in various forms and from two different types. The most commonly used forms in SQL Server are the graphical execution plan and the XML execution plan. The two type of execution plan are the estimated plan and the actual plan. The estimated plan includes the results coming from the query optimizer, and the actual plan is the plan used by the query engine. The beauty of estimated plan is that it does not require the query to be executed.
Read the execution plan from right to left and from top to bottom. Each step represents an operation performed to get the final output of the query. Some of the aspects of a query execution represented by an execution plan are as follows:
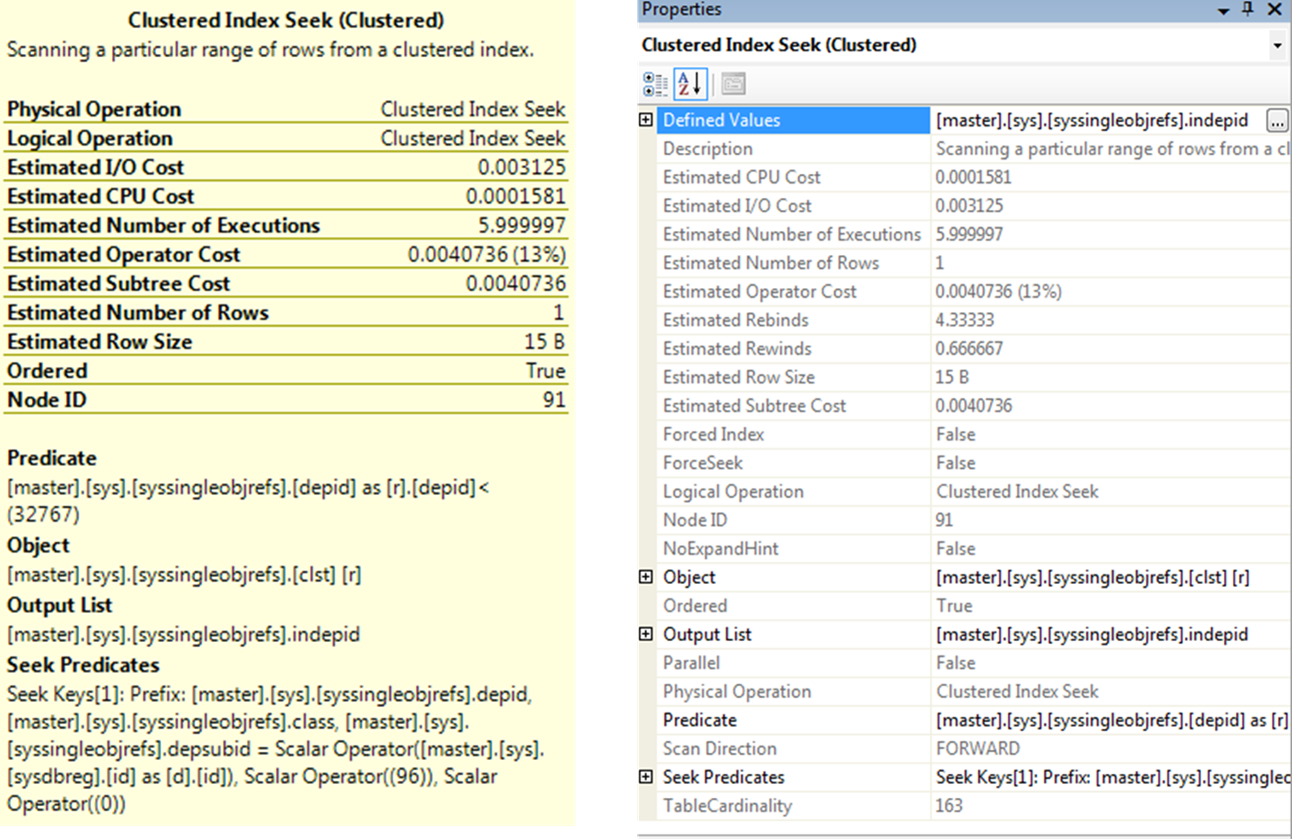
A complete set of d3tails about an operator is available in the Properties window which you can open by right-clicking the operator and selecting Properties. An operator detail shows both physical and logical operation types at the top.
Physical operations represent those actually used by the storage engine, while the logical operations are the constructs used by the optimizer to build the estimated execution plan. If logical and physical operations are the same, then only the physical operation is shown. It also displays other useful information, such as row count, I/O cost, CPU cost and so on.
The argument section in an o0erator detail pop-up windows is especially useful in analysis, because it shows the filter or join criterion used by the optimizer.
Your main interest in the execution plan is to find out which steps are relatively costly. These steps are starting point for your query optimization. You can choose the starting steps by adopting the following techniques:
Analyzing Index Effectiveness
To examine a costly step in an execution plan further, you should analyze the data-retrieval mechanism for the relevant table or index. First, you should check whether an index operation is a seek or a scan. Usually, for best performance, you should retrieve as few rows as possible from a table, and an index seek is usually the most efficient way of accessing a small number of rows. A Scan operation usually indicates that a larger number of rows have been accessed. Therefore, it is generally preferable to seek rather than scan.
The query optimizer evaluates the available indexes to discover which index will retrieve data from the table in the most efficient way. If a desired index is not available, the optimizer uses the next best index. For best performance, you should always ensure that the best index is used in a data-retrieval operation. You can judge the index effectiveness by analyzing the argument section of a node detail for the following:
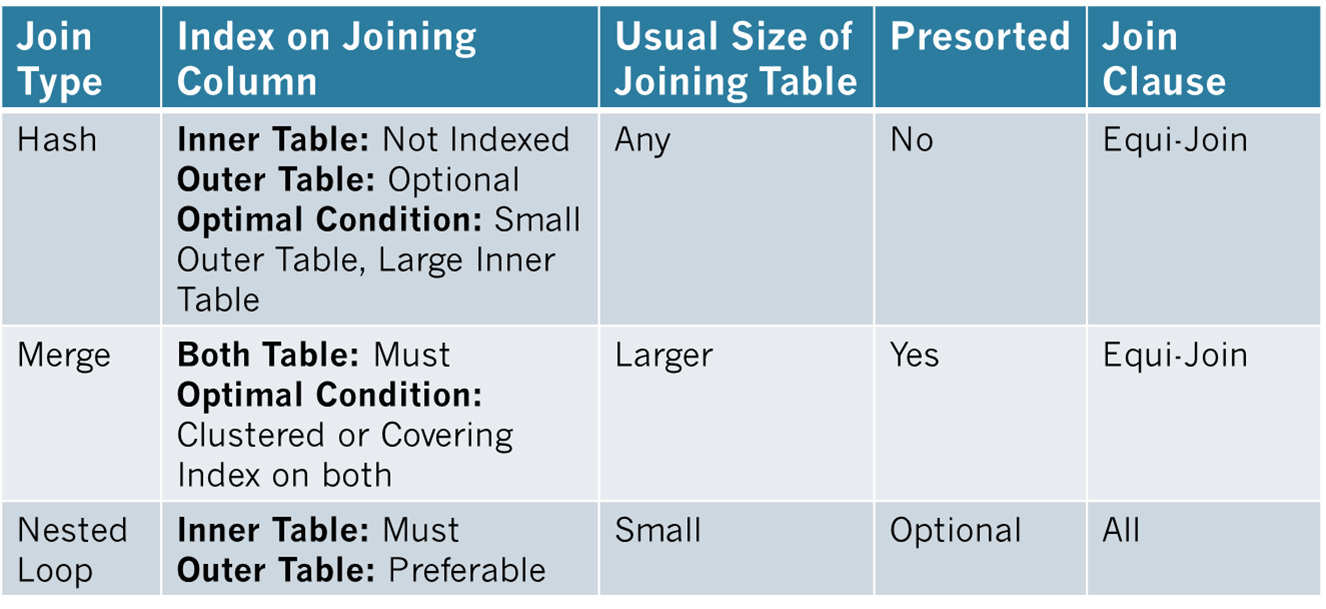
In addition to analyze the used indexes, you should examine the effectiveness of join strategies decided by the optimizer. SQL Server uses three types of joins:
In many simple queries affecting a small set of rows, nested loop joins are far superior to both hash and merge joins. The join types to be used in a query are decided dynamically by the optimizer.
Select P.* From Production.Product
JOIN Production.ProductSubCategory PSC
ON PSC.ProductSubCategoryID = P.ProductSubCategoryID;
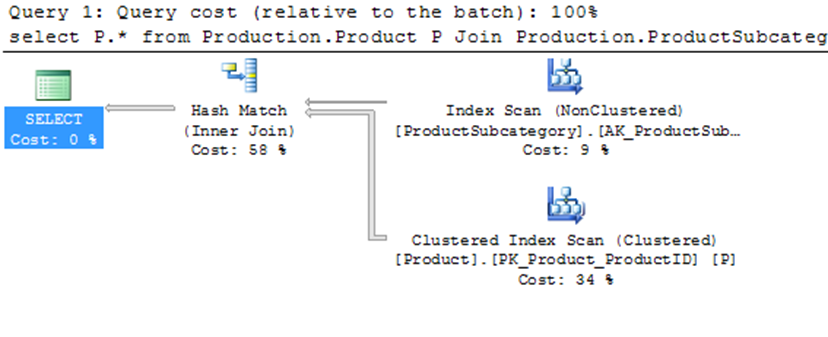
Note: The Query Optimizer uses Hash Join to process large, unsorted, non-indexed inputs efficiently.
You can see that the optimizer used a hash join between the two tables. A hash join uses the two join inputs as a build input and a probe input. The build input and a probe input. The build input is shown as the top input in the execution plan, and the probe input is shown as the bottom input. The smaller of the two inputs serves as the build input. The hash join performs its operation in two phases: the build phase and the probe phase. In the most commonly used form of hash join, the in-memory hash join, the entire build input is scanned or computed, and then a hash table is built in memory. Each row is inserted into a hash bucket depending on the hash value computed for the hash key. The query optimizer uses hash join to process large, unsorted, non-indexed inputs efficiently. A hash join uses memory and TEMPDB to build out the hash tables for the join.
Select P.* From Production.ProductModel P
Join Production.ProductModelProductDescriptionCulture PM
On PM.ProductModelID = P.ProductModelID;
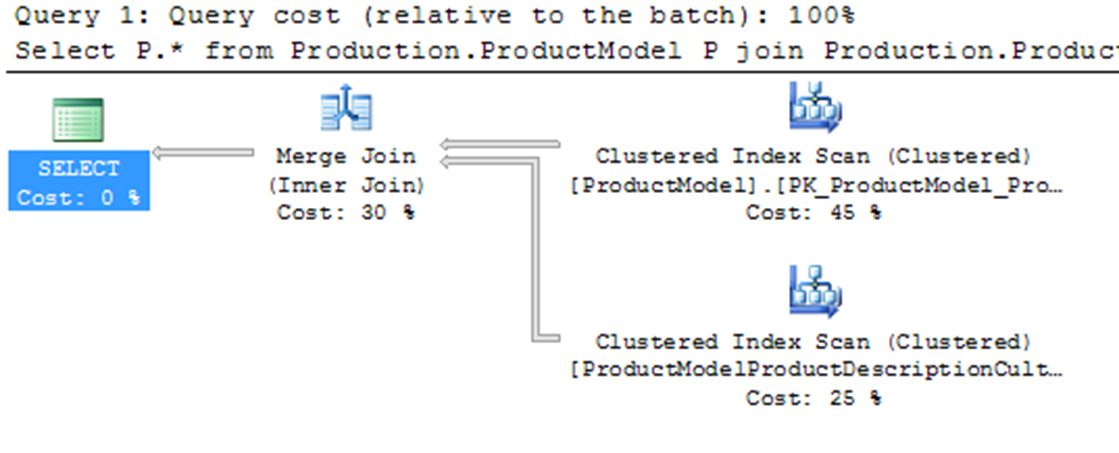
For the above query, the optimizer used a merge join between the two tables. A merge join requires both join inputs to be sorted on the merge columns, as defined by the join criterion. If indexes are available on both joining columns, then the join inputs are sorted by the index. Since each join input is stored, the merge join gets a row from each input and compares them for equality. A matching row is produced if they are equal. This process is repeated until all rows are processed. In this case, the query optimizer found that the join inputs where both sorted on their joining columns. As a result, the merge join was chosen as a faster join strategy than the hash join. A merge join uses memory and a bit of TEMPDB to do its ordered comparison.
Select S.* From Sales.SalesOrderHeader S
Join Sales.SalesOrderDetail D
On D.SalesOrderID = S.SalesOrderID
Where S.SalesOrderID = 43659

The final type of join is nested loop join, for better performance, you should always access a limited number of rows from individual tables. As you can see above, the optimizer used a nested loop join between the two tables. A nested loop join uses one join input as the outer input tale and the other as the inner input table. The outer input table I shown as the to0 input in the execution plan, and the inner input tale is shown as the bottom input table. The outer loop consumes the outer input table row by row. The inner loop, executed for each outer row, searches for matching rows in the inner input table.
Nested loop joins are highly effective if the outer input is quite small and the inner input is large but indexed. A loop join is fast because it uses memory to take a small set of data and compare it quickly to a second set of data.
The Estimated Query Plans are created without execution and contain an approximate Execution Plan. This can be used on any T-SQL code without actually running the query. So, for example, if you had an UPDATE query you could get the Estimated Query Plan without actually running the UPDATE. The Actual Query Plans are created after we sent the query for processing and it contains the steps that were performed.
Usually the Estimated and the Actual Plans have similar graphical representation, but they can differ in cases where the statistics are outdated or the query involves parallelism, etc... Additionally, you cannot create Estimated Plans for queries that create objects and work with them (i.e. a query using a temp table).
It is better to use the Estimated Execution Plan when the query execution time is very long or it may be difficult to restore the database to the original state after the query run.
You can display the Estimated Execution Plan in SQL Management Studio by pressing CTRL + L in the query window or by clicking the Display Estimated Execution Plan button in the SSMS menu icons.
You can display the Actual Execution Plan in the results set by pressing CTRL + M or by clicking the Include Actual Execution Plan button in the SSMS menu icons.
Set Showplan_All On;
The setting of SET SHOWPLAN_ALL is set at execute or run time and not at parse time. When SET SHOWPLAN_ALL is ON, SQL Server returns execution information for each statement without executing it, and Transact-SQL statements are not executed. After this option is set ON, information about all subsequent Transact-SQL statements are returned until the option is set OFF.
For example, if a CREATE TABLE statement is executed while SET SHOWPLAN_ALL is ON, SQL Server returns an error message from a subsequent SELECT statement involving that same table, informing users that the specified table does not exist. Therefore, subsequent references to this table fail. When SET SHOWPLAN_ALL is OFF, SQL Server executes the statements without generating a report.
Set Showplan_XML On;
The setting of SET SHOWPLAN_XML is set at execute or run time and not at parse time. When SET SHOWPLAN_XML is ON, SQL Server returns execution plan information for each statement without executing it, and Transact-SQL statements are not executed. After this option is set ON, execution plan information about all subsequent Transact-SQL statements is returned until the option is set OFF. For example, if a CREATE TABLE statement is executed while SET SHOWPLAN_XML is ON, SQL Server returns an error message from a subsequent SELECT statement involving that same table; the specified table does not exist. Therefore, subsequent references to this table fail. When SET SHOWPLAN_XML is OFF, SQL Server executes the statements without generating a report.
Set Showplan_Text On;
The setting of SET SHOWPLAN_TEXT is set at execute or run time and not at parse time. When SET SHOWPLAN_TEXT is ON, SQL Server returns execution information for each Transact-SQL statement without executing it. After this option is set ON, execution plan information about all subsequent SQL Server statements is returned until the option is set OFF. For example, if a CREATE TABLE statement is executed while SET SHOWPLAN_TEXT is ON, SQL Server returns an error message from a subsequent SELECT statement involving that same table informing the user that the specified table does not exist. Therefore, subsequent references to this table fail. When SET SHOWPLAN_TEXT is OFF, SQL Server executes statements without generating a report with execution plan information.
Set Statistics XML On;
The setting of SET STATISTICS XML is set at execute or run time and not at parse time. When SET STATISTICS XML is ON, SQL Server returns execution information for each statement after executing it. After this option is set ON, information about all subsequent Transact-SQL statements is returned until the option is set to OFF. Note that SET STATISTICS XML need not be the only statement in a batch.
Note: SET SHOWPLAN_TEXT and SET SHOWPLAN_ALL cannot be specified inside a stored procedure; they must be the only statements in a batch.
One final place to access execution plans is to read them directly from the memory space where they are stored, the plan cache. Dynamic Management Views and Functions are provided from SQL Server to access this data. To see a listing of execution plans in cache, run the following query:
SELECT P.QUERY_PLAN, T.TEXT
FROM SYS.DM_EXEC_CACHED_PLANS R
CROSS APPLY SYS.DM_EXEC_QUERY_PLAN(R.PLAN_HANDLE) P
CROSS APPLY SYS.DM_EXEC_SQL_TEXT(R.PLAN_HANDLE) TSQL
The query returns a list of XML execution plan links. Opening any of them will show the execution plan. Working further with columns available through the dynamic management views will allow you to search for specific procedures or execution plans.
Even though the execution plan for a query provides a detailed processing strategy and the estimated relative costs of the individual steps involved, it doesn’t provide the actual cost of the query in terms of CPU usage, reads/writes to disk, or query duration. While optimizing a query, you may add an index to reduce the relative cost of a step. This may adversely affect a dependent step in the execution plan, or sometimes it may even modify the execution plan itself. Thus, if you look only at the execution plan, you can’t be sure that your query optimization benefits the query as a whole, as opposed to that one step in the execution plan. You can analyze the overall cost of a query in different ways.
Maximize performance benefits by automatically detecting and resolving issues through AI-DBA intelligence optimization.
Request Demo